Survey123: Tips and Tricks for Enhancing Your Survey

Survey123 for ArcGIS℠ an Esri® application

Survey123 for ArcGIS℠ an Esri® application

Any organization looking to convert paper based field data collection workflows to a digital solution must consider using Survey123 for ArcGIS℠. Survey123 for ArcGIS℠ (Survey123) is a mobile app from Esri that supports form-centric data collection. This is useful for a wide range of workflows, from asset inspections to logging time on-site, and everything in between!

Survey123 is more than just an app; it is an entire solution for creating, sharing and analyzing field collected data. The survey forms can be created using a simple web interface by an ArcGIS℠ Online user, or using the more advanced Survey123 Connect desktop software. The wide range of applications for the Survey123 software is a great asset to any organization using GIS and can open the door for robust field data collection and subsequent analysis.

While surveys can be completed by end users using a simple web interface or a mobile app, the Survey123 Connect software allows analysts and developers to utilize Excel forms to create “smart” forms with advanced calculations, default values, conditional question filtering, and much more.

In this post, we will focus on some tips and tricks for enhancing your survey using the Survey123 Connect software including:

  1. How to use ‘Secret’ fields in your survey, and why

  2. How to maintain rolling totals from numeric form entries

  3. How to capture before and after pictures at a location

Note – It is assumed the reader has some level of familiarity with Survey123 Connect and related terminology used in this blog post.

Tip 1: How to use ‘Secret’ fields in your survey, and why

When using Survey123 Connect to author and publish surveys, the software will create and maintain a feature service that is needed to support the questions in the survey. Basically, each question in the survey equates to a field within the feature service that is created. However, sometimes you might have information in the survey that you don’t necessarily want to store as fields in the survey feature service. Examples of this can be temporary notes during survey creation or an intermediate calculation variable that does not need to be stored in a field upon submittal. To control this, Survey123 Connect users can use the bind::esriFieldType column in the survey’s XLS form.

The bind::esri:fieldType column allows you to control the type of field added to the survey’s feature service more precisely. For example, if you had a question that accepts an integer value but you want to store this as a text value in the feature service, you could set the bind::type value in the XLS form to int and bind::esri:fieldType to esriFieldTypeString. Other accepted values include:

  • esriFieldTypeString

  • esriFieldTypeDate

  • esriFieldTypeInteger

  • esriFieldTypeSingle

  • esriFieldTypeDouble

  • esriFieldTypeSmallInteger

  • esriFieldTypePointZ

  • esriFieldTypeGUID

  • null

null.png

Note the last value in the list above is null. This will cause the question to be omitted from the feature service associated with your survey! This works for all types of questions except Geopoints.

https://doc.arcgis.com/en/survey123/desktop/create-surveys/esricustomcolumns.htm


Tip 2: How to maintain rolling totals from numeric form entries

When using repeats within the survey form, it has traditionally been difficult to access data from different repeated instances from within your XLS form. However, starting at version 2.1 of Survey123, Esri has introduced aggregate functions that can be used to return values referencing the data across repeats! The aggregate functions that can be utilized are: count, sum, min, and max.

As an example, say you wanted to calculate the total number of hours worked in a day. To accomplish this, you could create a question in your survey XLS form inside a repeat called HoursSpent, which would allow users to input the number of hours spent on a particular task, and would allow them to create multiple entries. Additionally, you would create a field outside of your repeat called TotalHoursSpent, with the calculation set to sum(${HoursSpent}).

Calculation Table.png
HoursSpent_SingleEntry.png

The result would appear as shown on the right.

This image shows a single time entry.

 
HoursSpent_AdditionalEntry.png

This image shows an additional entry with the total hours calculated on the fly!

 
Mobile Image_Adding Photos to Survey.png

Tip 3: How to capture before and after pictures at a location

One of the great features of Survey123 is that it allows field workers to easily take photos and upload them with their survey response. This could be useful for maintenance workers to relay information on work completed, for crowd sourcing community information with images, or as in this case, attaching before/after photos for work completed for fire hazard mitigation.

This can be achieved by adding an image question, which allows the user to upload a photo from their device or upload one saved on their device. Multiple images can be added by using Repeats. However, this issue can get more complex if the survey item needs to be revisited in the future to add additional photos, as in the case with before/after photos.

However, this too is achievable through use of the Inbox. The Inbox is a feature that allows users to edit data that has already been submitted. This can be enabled in the Settings pane of your survey in Survey123 Connect. Additionally, SQL Where clauses can be enabled to restrict the number of values returned.

 
Adding Photos.png

For the example of adding before/after photos, a repeat (related table) was created to house photos and some attributes, which allows users to add multiple photos to a single survey. After adding the before photo, the survey is submitted.

At a later date, the user can return to this item through the Inbox, and add an after photo, then resubmit. In this example, some expression logic was used to tell the Inbox which records to make available to modify; this takes the form of a simple SQL expression such as: NeedsAfterPhoto = “yes”.


Uploaded Item.png

Upon navigating to the Inbox, the newly uploaded item with a before photo only appears and can be modified.

Note that there is a known limitation that previously added media cannot be modified once in the Inbox since the Inbox does not fetch/download attachments. This means that after photo(s) can be added, but you will not have access to your before picture.

Join VESTRA for a Webinar on Essential Web AppBuilder Widgets for Local Governments

VESTRA Resources, Inc. invites you to a FREE Webinar

Please register for Essential Web AppBuilder Widgets for Local Governments on Mar 07, 2019 11:00 AM PST at: 

https://attendee.gotowebinar.com/register/6040642512526582530

Local governments have three important workflows (among others) that are performed repeatedly. These include: 

  • Mailing notices to owners and/or tenants

  • Generating reports for commission hearings or for regulatory requirements, and

  • Researching information that is often spread across many systems. 

GIS can be an effective tool to perform the above workflows. This webinar will demonstrate three widgets that will allow local governments to quickly and easily generate mailing labels, create reports, and view information combined from several business systems in one location, within a Web AppBuilder based application. The widgets are essential to local government workflows and can save hours of effort and research time.

After registering, you will receive a confirmation email containing information about joining the webinar. We hope that you will be able to join us for the webinar. If you cannot attend the webinar, you can register and we will email you a recording.

If you have any questions, would like additional information, or to talk to one of our GIS experts, please contact us. More information about VESTRA's Enhanced Web AppBuilder Widgets can be found at http://www.vestra.com/gis/widgets/.

Three Keys to Getting Started with Insights for ArcGIS℠

Insights for ArcGIS℠ an Esri® application

Insights for ArcGIS℠ an Esri® application

Insights for ArcGIS℠ is a breakthrough application that empowers organizations to perform powerful data analytics, and gain advanced location intelligence from location data. With an intuitive drag and drop workflow, the product allows organizations to gain key insights, using a variety of visualizations, in a short amount of time. The product is so exciting that sometimes, users who want to dive in, well, do just that, without an organized approach to using the software. In this post, I would like to point out three keys that users should keep in mind before jumping in.
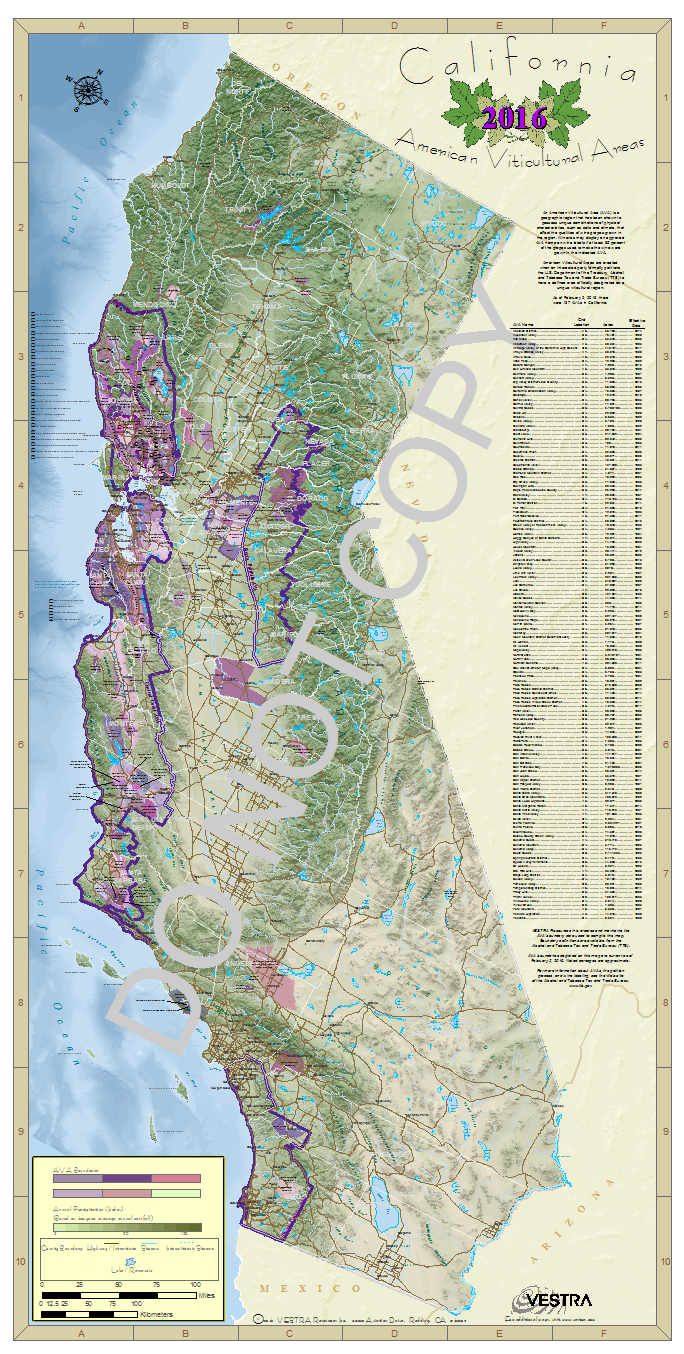
Photo by rawpixel on UnsplashAll the data pieces must be collected and prepared to fit right to tell a meaningful story

Photo by rawpixel on Unsplash

All the data pieces must be collected and prepared to fit right to tell a meaningful story

Key 1 - Take time to understand the data

Resist using the software until you have a thorough understanding of the data. It is very tempting to throw some data at the software and try to see what happens and what visualizations may automatically come alive. While there may be some visualization that is presented, it often won’t make much sense and will not provide the intelligence needed. It is very likely the analyst will be disappointed with the output. Instead, it is recommended to take a step back and really think about the data at hand in relation to the problem statement. Sometimes, it is like solving a puzzle and all the data pieces must be collected and prepared to fit right to tell a meaningful story.
The analyst should clearly understand the problem statement, expand on it with more specifics, by asking questions like –

  • What data do I already have to help me answer the problem?

  • What data am I missing?

  • Where can I find the missing data?

  • How do I prepare the missing data to fill gaps?

This leads us to the next key step to remember.

Key 2 - Ask progressively detailed questions to better define the problem

Start with a high level problem statement and begin to progressively add more details to the problem statement.

For example, a retailer may initially just simply ask –

“I want to map product sales in California”

The above sentence is a very high level problem statement. The analyst should be able to help better frame the question and take it from a high level one-liner problem statement to a question that is more specific.

So let’s look at the problem statement again and break it down a bit. Words that could be defined more have been bolded.

“I want to map product sales in California

If we were to frame more specific questions for each of the bolded words, it would probably be something like the below –

  • Product – which product in the product line? (e.g. for a clothing retailer it would be shoes, clothing, etc.)

  • Sales – What kind of sales (e.g. online store, brick and mortar stores, or both?)

  • California - What regions of California? (e.g. central valley or the bay area, or the entire state?)

At times, it would be helpful to ask additional questions to get a better context. For example, some additional related questions to help define the work to be done could be –

  • What is the date interval for the sales to be mapped? (e.g. last month, last year, etc)

  • Is there a target demographic? (e.g. infants, children, adults, etc)

Once more specific questions have been asked, a more defined question that could be used to begin further work could be as follows –

“I want to map clothing sales of the infant product line in the Bay Area from the online store within the last year”

Framing the question more specifically helps a great deal in knowing what data to gather and prepare for the analysis task at hand.

Key 3 - Know your visualizations

A common mistake people make when getting started with Insights for ArcGIS℠ is that they do not spend the time to understand visualizations available and what visualizations can tell the story the best. It is very important to study the visualizations that Insights for ArcGIS℠ offers. Most people are only familiar with bar or column charts, pie charts, or histograms.

Esri’s online help is a great resource for understanding the various visualizations. Be sure to study each visualization type and ensure you have a good grasp of a) how to use them, b) when to use them, and c) what data types you will need to build them.

GIS professionals may be mostly familiar with using maps to visualize and gather intelligence from location data. However, Insights for ArcGIS℠ provides a number of non-map visualizations, in addition to the traditional map based ones.

Here is a quick reference of some interesting non-map based data visualization options available in Insights for ArcGIS℠. For a full reference of all maps and charts available in Insights for ArcGIS℠, please visit Esri help.

Bar Chart

When To Use

Compare data across categories, understand difference in levels between categories, identify trends, outliers, highs, and lows, across categories

Data Types Needed

Y-axis: A String field (e.g. Category, Type, City, etc.). Optionally, a second String field can be provided to group values by a sub-category.

X-axis: An Integer or Decimal field. If this field is not provided, a count of the string values on the y-axis is displayed.

Box Plot

When To Use

Visualize groups of numerical data using quartiles, view outliers in data

Data Types Needed

Y-axis: An Integer or Decimal field.

X-axis: A String field can be optionally provided to group values

Bubble Chart

When To Use

Compare proportions of categories, how data categories are related

Data Types Needed

Y-axis: A String field.

X-axis: An Integer or Decimal field. If this field is not provided, a count of the string values on the y-axis is displayed.

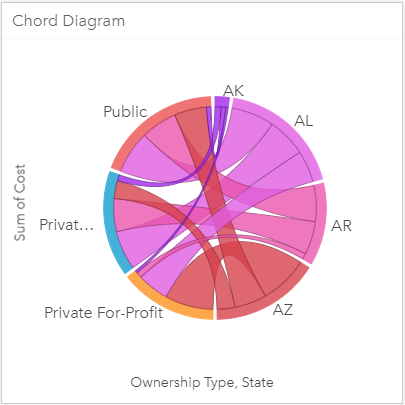
Chord Diagram

When To Use

Visualize inter-relationships and connections between categories

Data Types Needed

Y-axis: An Integer or Decimal field. If this field is not provided, a count is displayed.

X-axis: Two String fields.

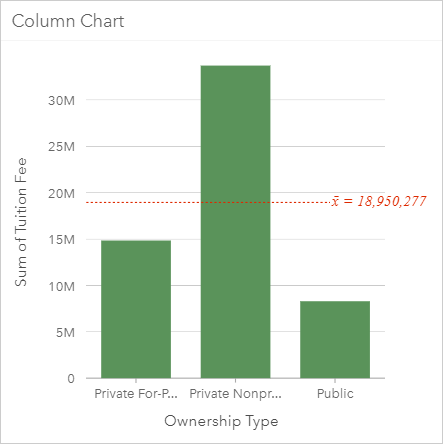
Column Chart

When To Use

Compare data across categories, understand difference in levels between categories, identify trends, outliers, highs, and lows, across categories

Data Types Needed

Y-axis: An Integer or Decimal field. If this field is not provided, a count of the string values on the x-axis is displayed.

X-axis: A String field (e.g. Category, Type, City, etc.). Optionally, a second String field can be provided to group values by a sub-category

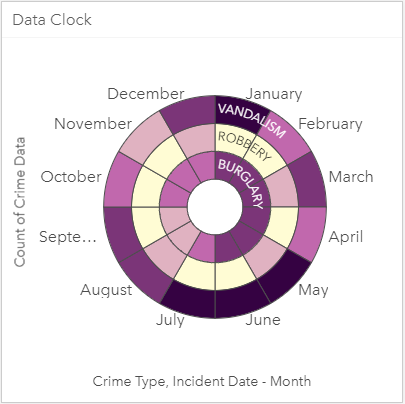
Data Clock

When To Use

Understand how much data exists at different periods of time

Data Types Needed

Y-axis: An Integer or Decimal field. If this field is not provided, a count is displayed.

X-axis: Two String fields.

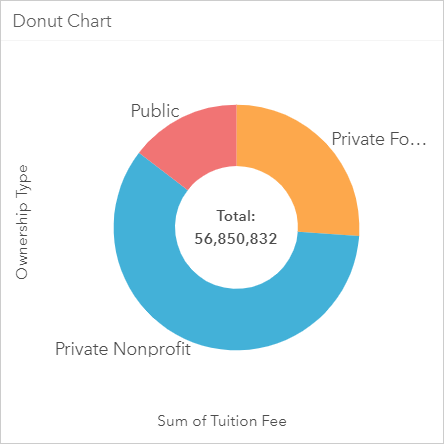
Donut Chart

When To Use

Compare proportions of categories

Data Types Needed

Y-axis: A String field

X-axis: Integer or Decimal field. If this field is not provided, a count of the string values on the y-axis is displayed.

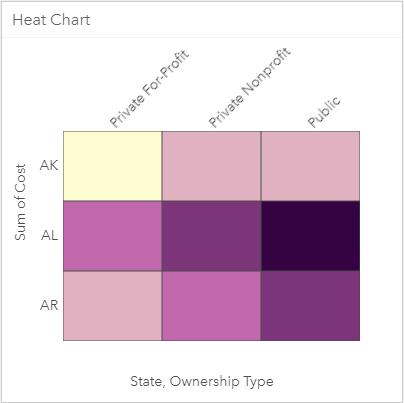
Heat Chart

When To Use

Visualize relationship between two categories

Data Types Needed

Y-axis: An Integer or Decimal field. If this field is not provided, a count is displayed.

X-axis: Two String fields.

Histogram

When To Use

View distribution of numeric variables and their frequency of occurrence within a dataset, view outliers in a dataset

Data Types Needed

X-axis: Integer or Decimal field.

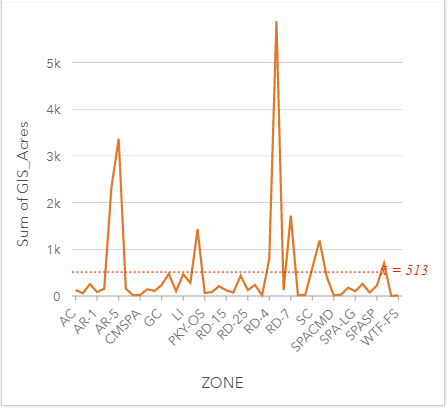
Line Graph

When To Use

Compare categories of data, compare differences/changes in a numeric value across categories

Data Types Needed

Y-axis: An Integer or Decimal field. If this field is not provided, a count of the string values on the x-axis is displayed.

X-axis: A String field. Optionally, a second String field can be provided to group categories

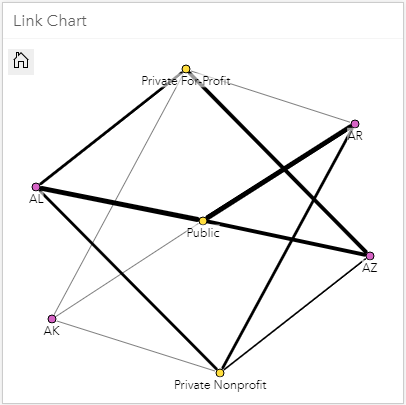
Link Chart

When To Use

Visualize relationships between categories, visualize flow of information between categories

Data Types Needed

Y-axis: An Integer or Decimal field. If this field is not provided, a count is displayed.

X-axis: Two String fields.

Scatter Plot

When To Use

Determine whether two variables are correlated and the strength of the correlation, compare distribution of two numeric variables, view outliers within a dataset

Data Types Needed

Y-axis: An Integer or Decimal field. This is the independent variable. Optionally, a second Integer or Decimal field can be provided

X-axis: An Integer or Decimal field. This is the dependent variable. Optionally, a second String field can be provided to color code the numeric values by category

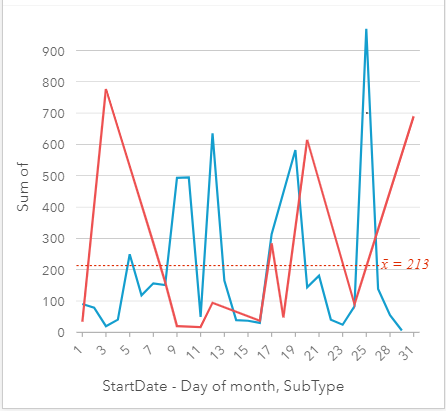
Time Series Graph

When To Use

Visualize trends in counts or numerical values, and how they change, over time.

Data Types Needed

Y-axis: An Integer or Decimal field. If this field is not provided, a count of the date values in the x-axis is displayed.

X-axis: A Date/Time field. Optionally, a second String field can be provided to group categories

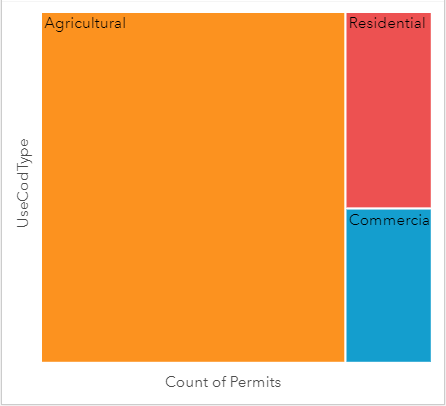
Treemap

When To Use

View hierarchy or compare proportions of categories

Data Types Needed

Y-axis: A String field. Optionally, a second String field can be provided to group categories

X-axis: Integer or Decimal field. If this field is not provided, a count of the string values on the y-axis is displayed.

Author: Solomon Pulapkura. Contact Solomon on LinkedIn

Esri Designates VESTRA as a Release Ready Specialty Partner

VESTRA has been designated a Release Ready Specialty Partner based upon Esri’s criteria, which includes:

  • Keeping pace with Esri technology;

  • Having industry experience;

  • Offering solutions, services, or content based on the latest Esri software releases; and

  • Helping users make smart decisions using the ArcGIS platform.

Contact us if you need assistance with an upgrade.

Injured Deer Survives Delta Fire

Delta Buck.JPG

As part of VESTRA's Biological Monitoring on the Delta Fire clean up, Anna Prang assisted CDFW with relocating an injured buck that she had been monitoring at the Delta Fire burn site for 4 days.

Anna worked with a CDFW Biologist to locate the buck around noon last Friday. CDFW decided the best approach would be to anesthetize the deer to examine his burn wounds more closely. After the buck was anesthetized, they moved in with water, iodine solution, etc. to find what appeared to be very painful but survivable burn wounds on the legs, groin, and "armpit" areas. CDFW then made the difficult decision to move the buck. Without relocation, the odds of a recovery were very small, as at this time he was living in a completely burned area with no food, limited cover, and his mobility was decreased due to his injuries. Anna scouted out the area earlier in the morning for a decent relocation site; and it was decided to deliver the buck to a peaceful, un-burned creek side site not too far from where it was believed his home range was. Anna checked the next morning and did not see him — but was pretty sure that the buck had gotten some food and water and sought out a place that satisfied his deer senses.

VESTRA is proud to be a part of what we hope is a happy ending for the injured buck- especially in the midst of this devastating wildfire season.

VESTRA's Fall 2018 Conference Schedule

VESTRA will be attending the following shows in the months of September and October.

  1. MISAC Annual Conference 2018 | September 30-October 3, 2018 | Booth #503 | Westin Mission Hills Golf Resort & Spa, Rancho Mirage, CA

  2. GIS-Pro & CalGIS 2018 | October 9-12, 2018 | Booth #310 | Palm Springs Convention Center & Renaissance Palm Springs Hotel, CA

  3. 2018 NGIS Conference | October 16-18, 2018 | Booth #8 | Whitney Peak Hotel, Reno, NV

At these conferences, we will be exhibiting and discussing our GIS products and services. We have a number of exciting solutions tailored to the GIS market that you shouldn't miss, including our ArcGIS℠ Online Launch Kits, Enhanced Web AppBuilder (WAB) Widgets, Location Strategy Jumpstarts, our new Managed Services options, and more!

We will also be showcasing our GeoSystems Monitor®, the best real-time GIS monitor available on the market today. VESTRA recently released a new version of the GeoSystems Monitor with a new design and a number of new features and enhancements. Please stop by to discuss the product with one of our representatives and to view a product demo. The GeoSystems Monitor is available for your full Enterprise GIS Platform or for ArcGIS℠ Online only.

To explore the GIS products and services offered by VESTRA, visit our GIS Homepage. If you don't see what you need, please feel free to contact us to see how we can assist you or stop by one of our booths at the above conferences to speak to one of our GIS experts.

Galen Keily, GIS Analyst at the MISAC 2018 Conference in Rancho Mirage

Galen Keily, GIS Analyst at the MISAC 2018 Conference in Rancho Mirage

Solomon Pulapkura, GIS Project Manager at the 2018 NGIS Conference in Reno, Nevada

Solomon Pulapkura, GIS Project Manager at the 2018 NGIS Conference in Reno, Nevada

Solomon Pulapkura, VESTRA GIS Project Manager and Raj Patil, Lucity Director of Strategic Partnerships at the 2018 URISA CalGIS & GIS Pro Conference in Palm Springs

Solomon Pulapkura, VESTRA GIS Project Manager and Raj Patil, Lucity Director of Strategic Partnerships at the 2018 URISA CalGIS & GIS Pro Conference in Palm Springs

GeoSystems Monitor v4.0.0 release is now available

VESTRA Resources, Inc. announces the highly anticipated GoeSystems Monitor v4.0.0 release is now available for download.  The Silverlight version of the product has been depreciated and the product rebuilt in JavaScript. Design changes and new features are listed below.

DESIGN

  • UI style and design updated using Bootstrap 3

  • In JavaScript (deprecates Silverlight)

  • Works in all modern browsers (Edge, IE 11+, Firefox, Chrome)

NEW FEATURES

  • License Manager Module

  • Reports and Charts upgraded to new ReportLab libraries

  • Added/combined support for Vector Tile services

  • Increased WMI disk drive checks

  • Added support for Postgres databases

  • Redesigned SDE Layer checks

  • Added support for Oracle 12c

  • Redesigned MSSQL authentication practices

  • Key focus on Windows Authentication

  • Easier creation of containers and auto-population of services

  • Ability to “refresh” containers to add new services/remove old

  • Added a governor to manage cold start monitoring

  • Added “connections” to save credentials

  • Added ability to rearrange tabs

Contact us for more information or to request a demo.

VESTRA's 2018 4-H and FFA Program Support

VESTRA is a longtime supporter of 4-H and FFA programs, and attempts to purchase animals in all counties where we work. For the 2018 fair season VESTRA purchased animals from 4-H and FFA members at the Glenn County Fair, Intermountain Fair, Shasta District Fair, and Trinity County Fair. A summary of VESTRA’s 2018 participation is as follows:

  • Kenzie Eddy | Lake 4-H Club | Glenn County Fair | 4-H Market Hog

  • Isabella Cordova | Intermountain Fair | 4-H Market Hog

  • Aaron Forschler | Anderson FFA | Shasta District Fair | 2018 Grand Champion Poultry Meat Pen & 2018 FFA Champion Poultry Meat Pen

  • Dillon Fuentes | Central Valley FFA | Shasta District Fair | FFA Market Goat

  • Austin Grace | Swede Creek 4-H | Shasta District Fair | 4-H Market Hog

  • Cody Hawes | Golden Acres 4-H | Shasta District Fair | 4-H Market Goat

  • James Johnston | Twin Palms 4-H | Shasta District Fair | Pen of 3 Market Rabbits

  • Glorianna Junokas | Golden Acres 4-H | Shasta District Fair | Pen of 3 Market Rabbits

  • Chloe Schultz | Golden Acres 4-H | Shasta District Fair | 4-H Market Hog

  • Addie Snyder | Happy Valley 4-H | Shasta District Fair | 4-H Market Lamb

  • Aubrey Nelson | West Valley FFA | Shasta District Fair | 4-H Market Hog

  • Kassidy Zulliger | Golden Acres 4-H | Shasta District Fair | 4-H Market Goat

  • Michael Willis | Happy Valley 4-H | Shasta District Fair | 2018 4-H Champion Poultry Meat Pen

  • Joseph Johnston | Twin Palms 4-H | Shasta District Fair | Pen of 3 Market Rabbits

  • Abriana Coulter | Trinity County Fair | Pen of 3 Market Rabbits

  • Lydia Yarbrough | Trinity County Fair | Pen of 3 Market Rabbits

VESTRA looks forward to supporting 4-H and FFA members in 2019!

VESTRA's 2018 AVA Maps Now Available!

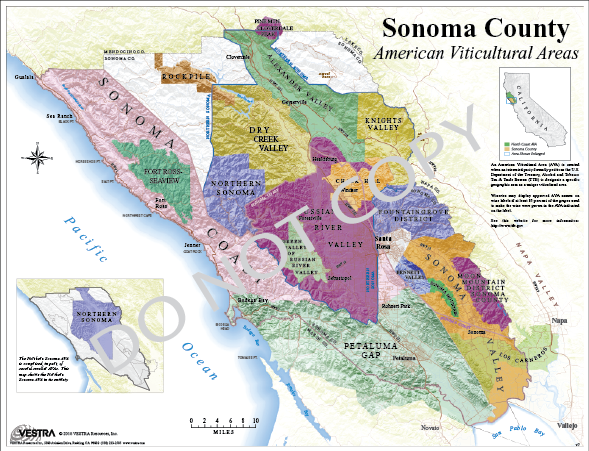
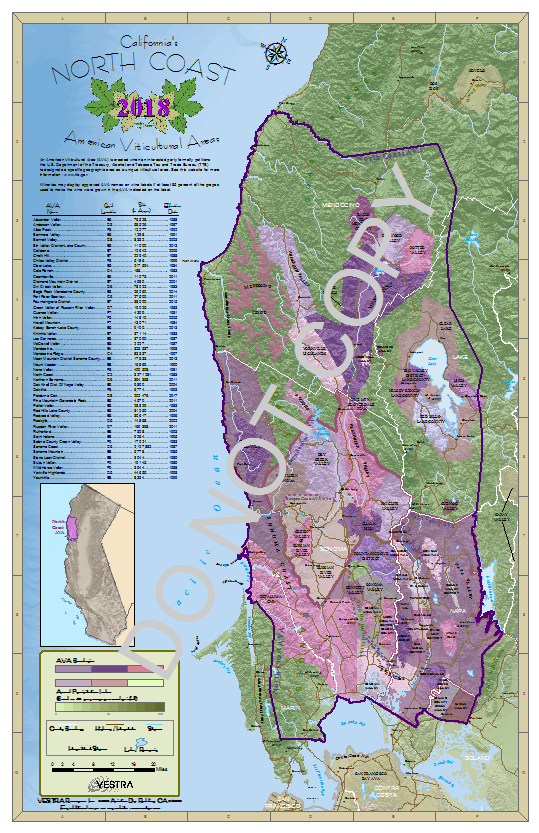
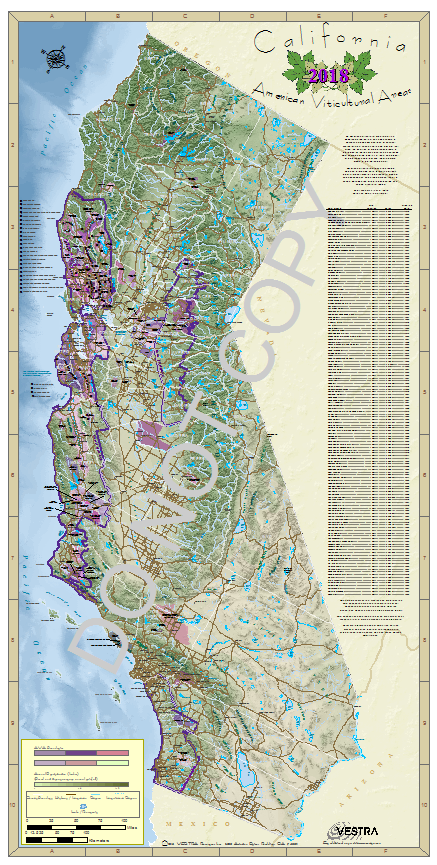
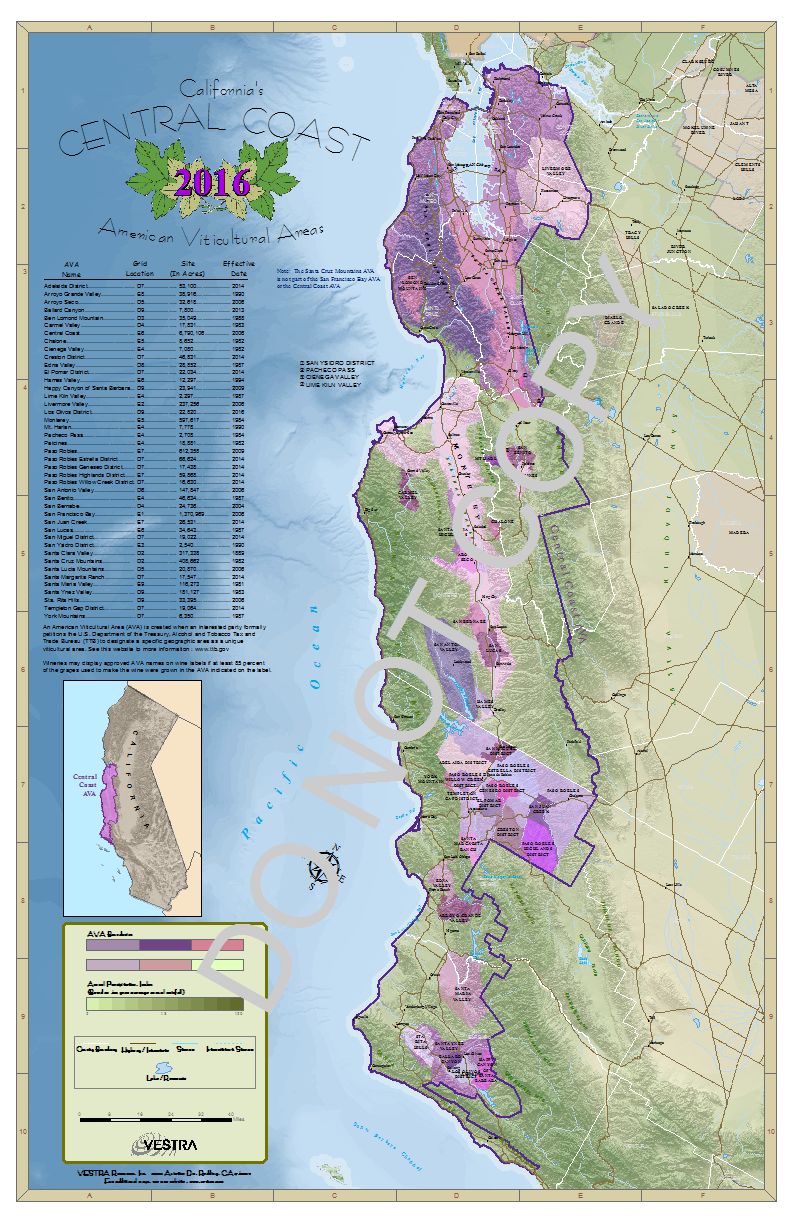
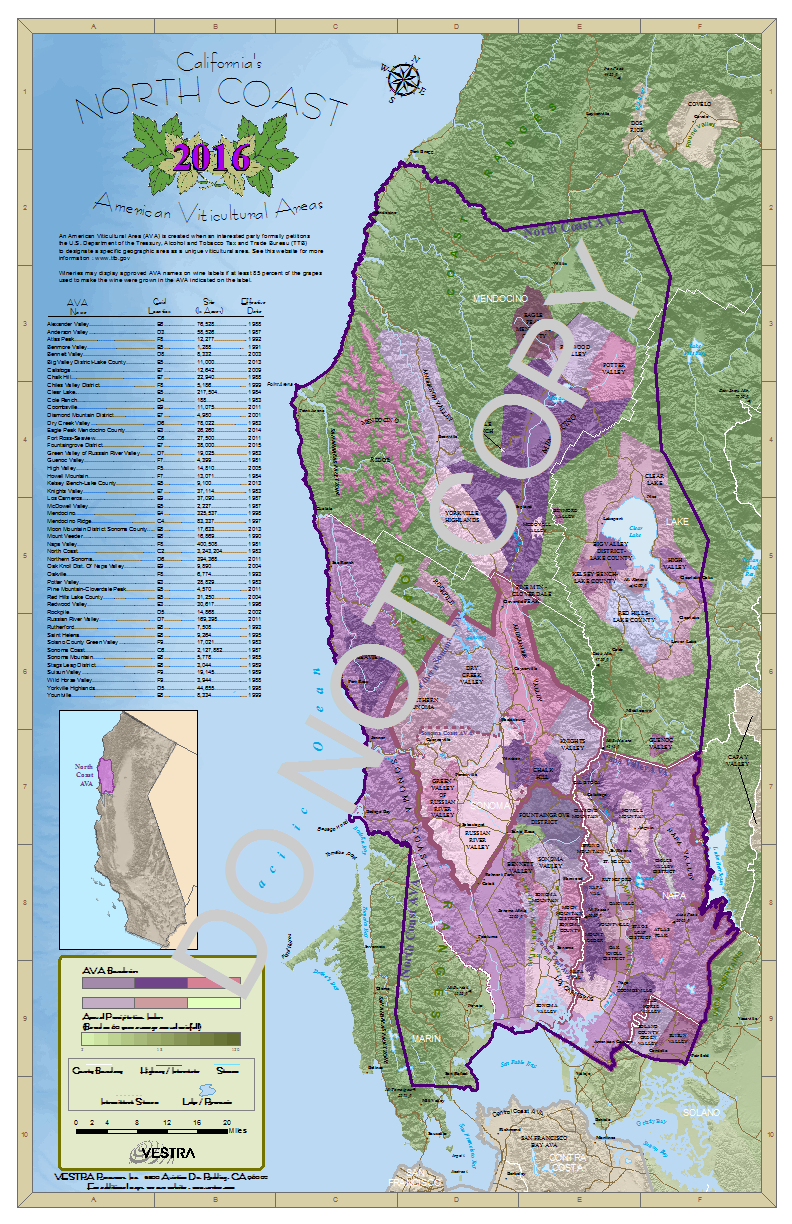
VESTRA's 2018 American Viticultural Area (AVA) maps are now available! Our popular AVA maps feature geographically accurate, legally recorded AVA boundaries as established by the Alcohol and Tobacco Tax and Trade Bureau (TTB).

The 2018 AVA map updates include:

  1. California AVA map:

    • Establishment of the 202,476-acre Petaluma Gap AVA in Sonoma and Marin Counties

    • Expansion of the North Coast AVA

  2. North Coast AVA map:

    • Establishment of the 202,476-acre Petaluma Gap AVA in Sonoma and Marin Counties

    • Expansion of the North Coast AVA

  3. Sonoma County AVA map:

    • Establishment of the 202,476-acre Petaluma Gap AVA

Visit the AVA (Viticultural) maps page, or call us for more information or to place an order.

VESTRA also creates custom maps to your specifications. Give us a call to discuss your design and get a quote.


VESTRA's 2017 AVA Maps Now Available

VESTRA's 2017 American Viticultural Area (AVA) maps are now available! Our popular AVA maps feature geographically accurate, legally recorded AVA boundaries as established by the Alcohol and Tobacco Tax and Trade Bureau (TTB).

The 2017 AVA map updates include:

  1. California AVA map:
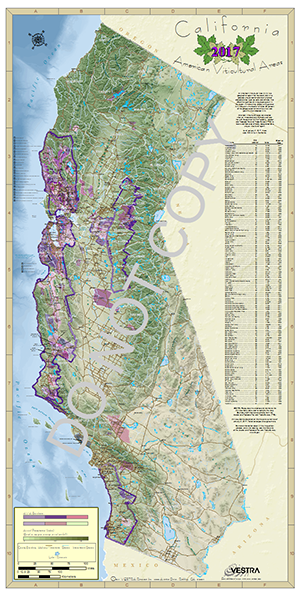
    • Establishment of the 29,369-acre Lamorinda AVA in Contra Costa County
    • Expansion of the Sta. Rita Hills AVA in Santa Barbara County
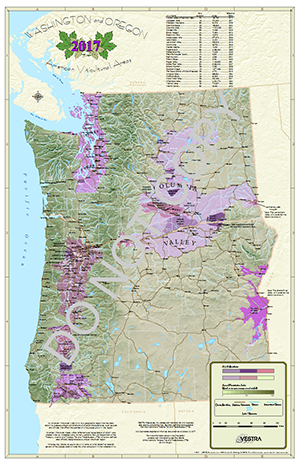
  2. Oregon/Washington AVA map:
    • Establishment of 306,650-acre Lewis-Clark Valley AVA in Washington
    • Realignment of the Columbia Valley AVA in Washington
    • Expansion of the Willamette Valley AVA in Oregon
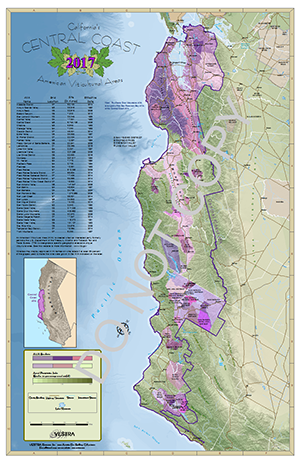
  3. Central Coast AVA map:
    • Establishment of the 29,369-acre Lamorinda AVA in Contra Costa County
    • Expansion of the Sta. Rita Hills AVA in Santa Barbara County
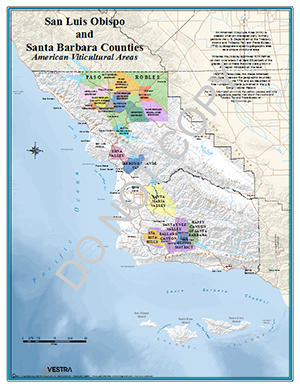
  4. Santa Barbara/San Luis Obispo Counties AVA map:
    • Expansion of the Sta. Rita Hills AVA in Santa Barbara County

Visit the AVA (Viticultural) maps page, or call us for more information or to place an order.

VESTRA also creates custom maps to your specifications. Give us a call to discuss your design and get a quote.  


VESTRA Resources, Inc. Awarded Contract for Geographic Information Systems (GIS) Program Services from the City of Elk Grove

VESTRA Resources, Inc.  announced November 2016 that it has been awarded the contract for the Geographic Information Systems (GIS) Program Services by the City of Elk Grove, California.  VESTRA Resources, Inc., teaming with Fremont Environmental Consulting (FEC), located in Folsom, California, will assist the City by leading and guiding them in leveraging their GIS more effectively through their GIS Program Services.

“The value of GIS has long been recognized for urban planning, but it is now playing an integral role in helping cities increase information delivery and services, control costs, and become partners with their residents and businesses,” said VESTRA's CEO Art Stackhouse. “We are honored to help cities like Elk Grove with their GIS needs.”

The City’s GIS solution is powered by Esri.

About Elk Grove, CA

Elk Grove is a city in Sacramento County, California, located just south of the state capital of Sacramento. It is part of the Sacramento–Arden-Arcade–Roseville Metropolitan Statistical Area. According to Wikipedia; as of 2015, the population of the city was estimated at 167,965. The second-largest city in Sacramento County, Elk Grove was the fastest growing city in the U.S. between July 1, 2004, and July 1, 2005.

About VESTRA Resources, Inc.:

Since 1988, VESTRA Resources, Inc. has been an industry leader in Enterprise GIS design, customization and implementation.  They specialize in consulting with industries such as Local, State & Federal Government, Healthcare, Agriculture, Natural Resources, and Transportation. They’re an Esri Certified Gold Partner and have been honored with the following designations: ArcGIS Online Specialty Partner, ArcGIS for Local Government Specialty Partner, ArcGIS Marketplace Provider, and Federal Small Business Specialty Partner.  They also developed the GeoSystems Monitor – the best real-time Enterprise GIS monitoring system used by many large clients worldwide. To learn more about VESTRA Resources, Inc., visit: www.vestra.com


VESTRA’s GeoSystems Monitor Now Available on ArcGIS Marketplace

VESTRA Resources, Inc. is happy to announce the availability of GeoSystems Monitor for ArcGIS Online on Esri’s ArcGIS Marketplace.

GeoSystems Monitor for ArcGIS Online allows your ArcGIS Online Administrator (or other ArcGIS Online User) to receive instant alerts pinpointing issues when your maps or services fail, helping you to get back online before users call. 

CORE FEATURES:

  • Real-Time Performance Monitoring of ArcGIS Online Web Maps & Apps
  • Instant Text and/or Email Alerts
  • Rapidly Pinpoint Issues
  • Charts, Graphs & Historical Database
  • Customized User Interface
  • Affected User Identification
  • Easy Installation & Setup

Be Proactive Rather Than Reactive!

What are you waiting for?  Download FREE 30-Day Trial Now! 

Maryland’s MD iMAP Platform – Helping Government Work for the People

The innovative State of Maryland continually strives for change including using science to help drive policy during crucial decision-making processes.  Since 2007, the State began applying Geographic Information Systems (GIS) as an enterprise solution for challenges and needs within its many communities.  They advanced using GIS to map services, resources, and opportunities so they could measure outcomes and performance and use the data collected to discover patterns, problems, and find solutions.

Today Maryland’s Enterprise GIS system, MD iMAP ( http://imap.maryland.gov), is used by almost every Maryland State Agency in one way or another.  This Enterprise GIS system provides geospatial data and services for government agencies, provides public facing applications for the citizens of Maryland, as well as maintaining data that is consumed by private entities such as GIS, real estate, architecture, engineering, and environmental professionals.

Currently managing Maryland’s GIS infrastructure is the Maryland Department of Information Technology (DoIT)/Geographic Information Office (GIO).  They provide map services, custom applications, open data, training and support to all who use the MD iMAP Platform.

MD iMAP uses the ArcGIS Platform to support mission critical functions within its many agencies; including, Emergency Management, Public Safety, Health and Human Services, Housing, Environment, Transportation, Education, Business, and Planning.  The DoIT GIO Team hosts all MD iMAP services through ArcGIS for Server, uses ArcGIS for Desktop for analysis and data management, and works in ArcGIS Online for collaboration to create unique web mapping applications.

They rely on ArcGIS to provide real-time services across state agencies when responding to an event such as a hurricane or a planned statewide celebration.  The DoIT GIO Team are able to post accurate, real-time information to their website to keep citizens informed and aware of what is happening around them during the emergency.  For example, Maryland Emergency Management Agency’s (MEMA) OSPREY applications are emergency management and public safety situational awareness viewers that allow the public and state agencies to quickly view information such as power outages, hospital statuses, open shelters, weather feeds and alerts, population distribution statuses, critical infrastructure, and more.

Maryland state agencies that work with GIS use MD iMAP services on a daily basis.  If those services went down for an extended period of time, they would not be able to perform their jobs.  The impact could be very large, especially for the emergency management and public safety community.

“As a measure to be more proactive than reactive in maintaining a resilient and robust MD iMAP, we decided we needed a monitoring system.  Without one,” Matthew Sokol, Senior GIS Analyst for the Maryland Department of Information Technology/Geographic Information Office, admitted, “it’s likely our customers would be reporting issues with services before we knew about them.”

After looking to find the best monitoring system, the GIO Office decided on Esri Partner - VESTRA Resource, Inc.’s GeoSystems Monitor which allows the DoIT GIO to monitor their ArcGIS for Server map services, ArcGIS Online services, OGC services, database services, as well as many other components. They decided on GeoSystems Monitor because of the comprehensive dashboard view, its alerting capabilities, and the wide scope in the types of services that could be monitored including the components behind the services.

 “On the server side, being able to monitor Disk Space, Memory and CPU usage across all of our servers is vital to keeping the system running at an optimal level,” said Sokol.

“GeoSystems Monitor allows me to better respond to issues in our system and provide the best possible customer support.  Through its email and text message alerting capability, I know about critical system issues anywhere and at any time.  Maintaining the MD iMAP Enterprise GIS is one of our office’s primary functions.  GeoSystems Monitor enables us to provide the level of service that our customers and agency leadership expect from an Enterprise GIS,” Sokol stated.

“One of my favorite things about GeoSystems Monitor is the dashboard level view of my systems.  It’s a simple way to see how the system is functioning at a high level and if there are issues that need my attention.  The level of customization is important because not every service is the same.  Most importantly, it provides us an intangible benefit of good customer service to our end users,” added Sokol.

For more information, contact Matthew Sokol, GISP, Senior GIS Analyst, Maryland Department of Information Technology, at matthew.sokol@maryland.gov or VESTRA Resources, Inc. at info@vestra.com / http://www.vestra.com

Web GIS Helps Small City Deploy Maps Faster

Concept-to-Prototype Reduced to Less Than a Day

By Matthew DeMeritt, Esri Writer

It’s a steep climb implementing an enterprise GIS — especially with a staff of one lone soul. Sometimes a city needs professional guidance to future-proof its map services. To ensure a lasting solution that grows with its needs, Mountain View, California, collaborated with Esri Professional Services and geospatial firm VESTRA Resources, Inc. (VESTRA), to transition from a limited desktop mapping system to a full enterprise GIS (EGIS). That partnership connected all of Mountain View’s business systems and laid a solid foundation for rapid web map deployment at the city.

Read Full Article here: https://medium.com/@Esri/web-gis-helps-small-city-deploy-maps-faster-7ec0b1c19952#.mdjppmuur


VESTRA's 2016 AVA Maps Now Available!

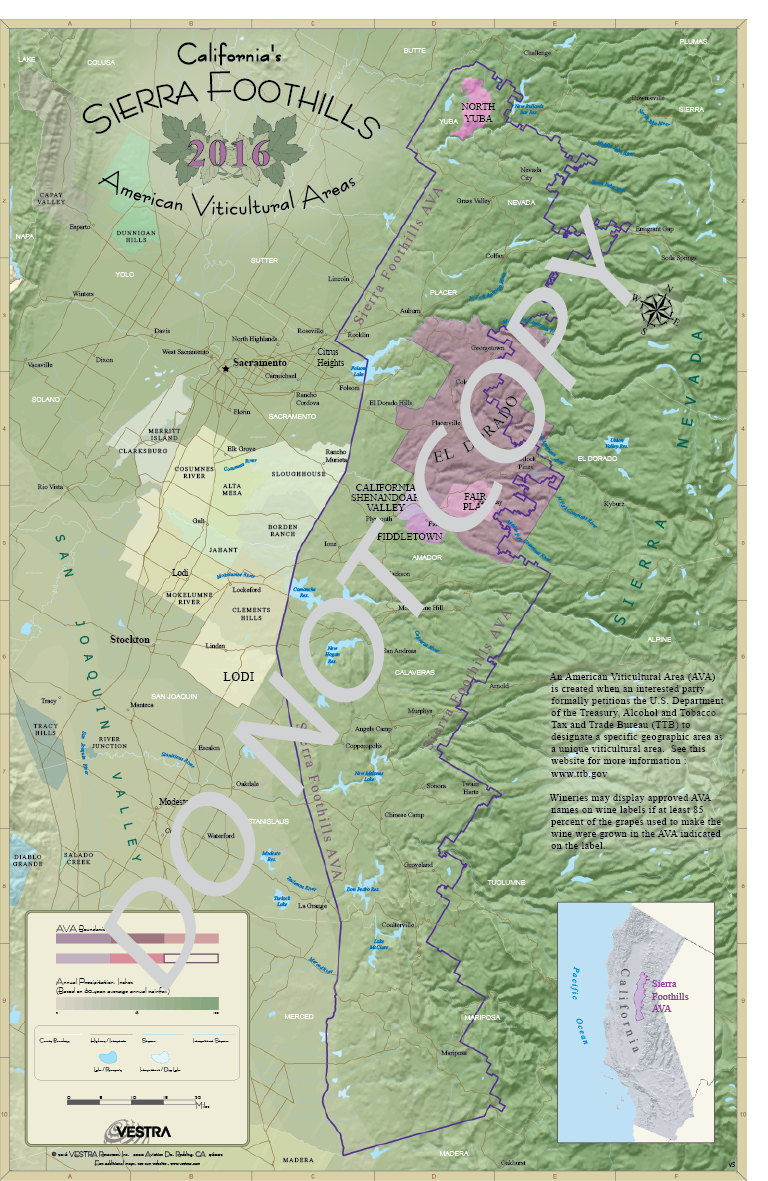
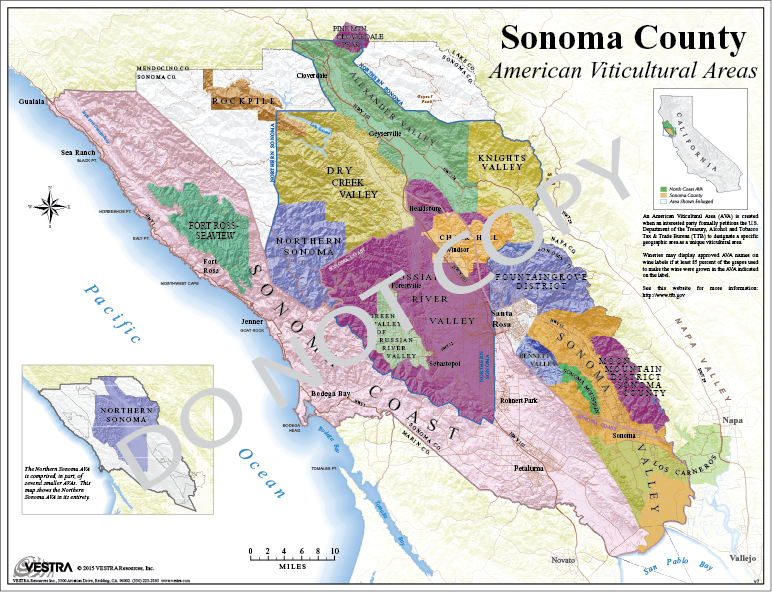
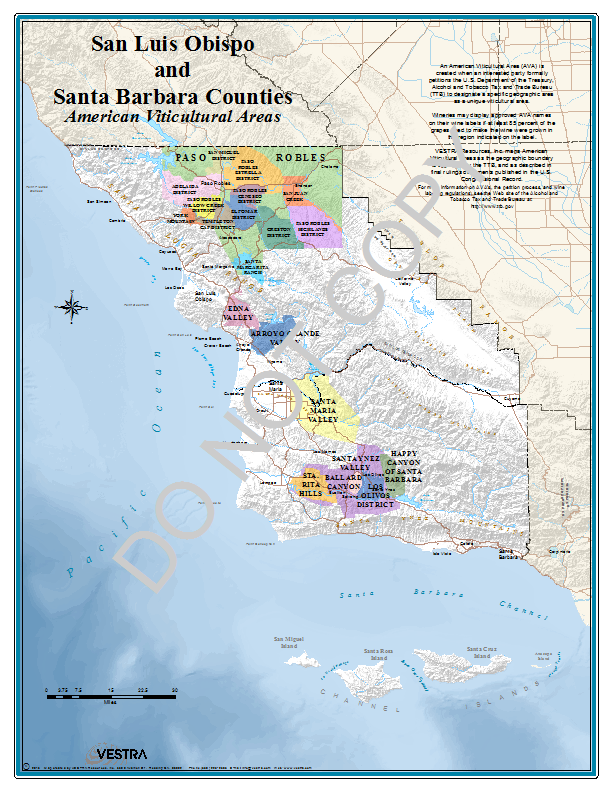
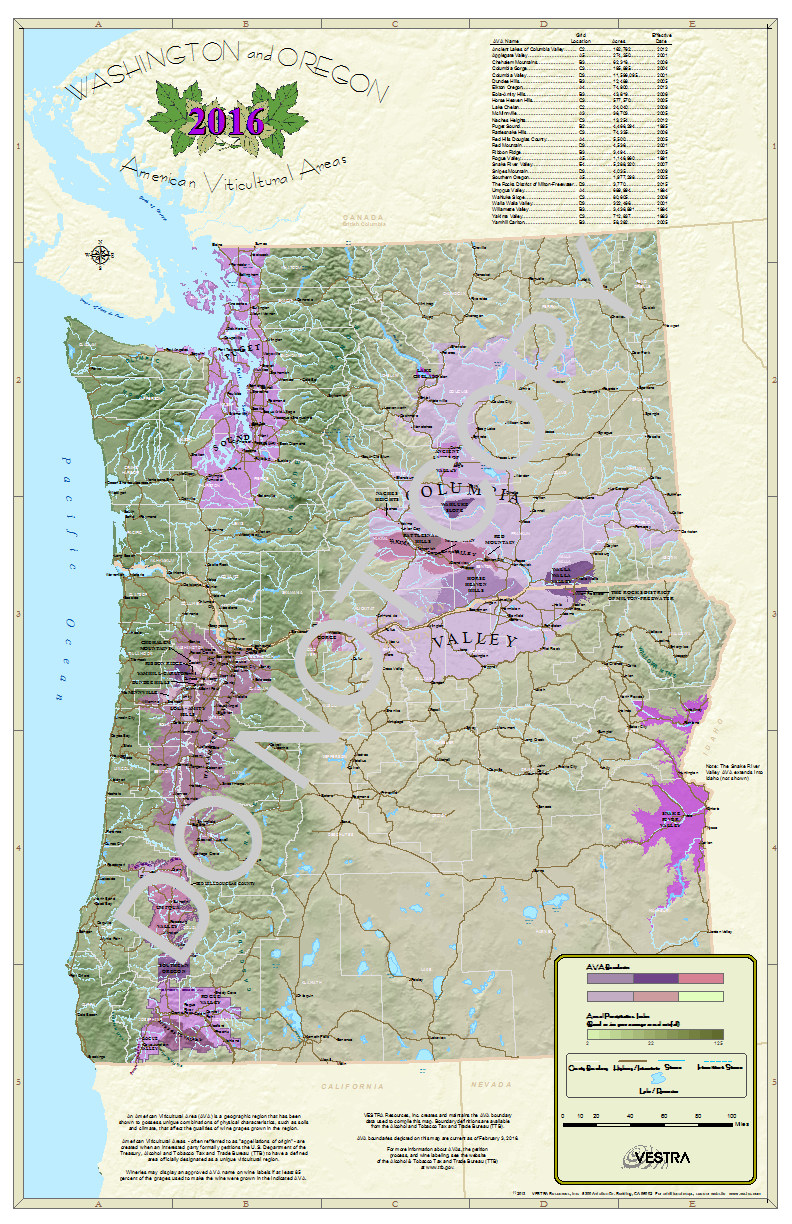
VESTRA's 2016 American Viticultural Area (AVA) maps are now available! Our popular AVA maps feature geographically accurate, legally recorded AVA boundaries as established by the Alcohol and Tobacco Tax and Trade Bureau (TTB).  

The 2016 map updates include:

  • Establishment of the 38,000-acre Fountaingrove District AVA in Sonoma County, California
  • Establishment of the 44,690-acre Squaw Valley-Miramonte AVA in Fresno County, California
  • Expansion of the Fair Play AVA in El Dorado County, California
  • Establishment of the 22,820-acre Los Olivos District AVA in Santa Barbara County, California
  • Establishment of the 3,770-acre The Rocks District of Milton-Freewater AVA in Umatilla County, Oregon

Updated 2016 maps include:

  • California
  • Oregon/Washington
  • North Coast
  • Central Coast
  • Sierra Foothills
  • Sonoma County
  • Santa Barbara/San Luis Obispo Counties

Visit the AVA (Viticultural) maps page at http://www.vestra.com/environmental/products/ava-vit-maps, or call us for more information or to place your order today.

VESTRA also creates custom maps to your specifications. Give us a call to discuss your design and get a quote. 


VESTRA Awarded Esri ArcGIS For Local Government Specialty Designation

Jan 27, 2016 -- VESTRA Resources, Inc., an Esri Gold Partner, was recently designated by Esri as an ArcGIS for Local Government Specialty Partner. This designation recognizes partners who demonstrate subject matter expertise in the local government marketplace who work closely with Esri and its user community on the development and deployment of the ArcGIS for Local Government solution.

To earn the ArcGIS for Local Government Specialty, partners must demonstrate that their services and solutions leverage the ArcGIS for Local Government information model to the benefit of their customers.

VESTRA is looking forward to working with local governments to adopt and extend the Local Government Information Model and to contribute to the maps, applications, and tools that will be made available.

VESTRA is a full-service geospatial and IT systems provider, and has built a reputation for providing cutting-edge GIS services such as GIS Enterprise Design, Implementation and Support, Enterprise GIS Software Development and Training, GIS Data Management, and 3D Mapping and Modeling. Since 1988, VESTRA has provided cutting-edge geospatial solutions to clients of all sizes representing government and private organizations, throughout the United States. VESTRA was established to specialize in Geographic Information System (GIS) technology and was among the first consulting firms in the United States to offer a full spectrum of GIS development services. VESTRA is an Esri-Certified Gold Partner, ArcGIS Online Specialty Partner, and ArcGIS for Local Government Specialty Partner.

VESTRA Resources, Inc. - http://www.vestra.com

Esri’s ArcGIS for Local Government - http://www.solutions.arcgis.com/local-government/

Solomon Pulapkura Successfully Completes Project Management Professional (PMP) Certification Examination

VESTRA Resources, Inc. of Redding, California is proud to announce that Solomon Pulapkura, Project Manager/Senior GIS Specialist, successfully completed the Project Management Professional (PMP) Certification, on Wednesday, December 30, 2015. The PMP is the gold standard of project management certification. Recognized and demanded by organizations worldwide, the PMP validates a person’s competence to perform in the role of a project manager, leading and directing projects and teams.

Solomon has demonstrated a commitment to the industry, the company, the profession, and his own career. By studying for and taking the certification examination, Solomon has shown that he has the knowledge to be an exemplary project manager in virtually any industry, anywhere in the world, and with any project management methodology.

According to Art Stackhouse, President, VESTRA, "Solomon has demonstrated his commitment to excellence by getting his PMP certification. Through encouraging its employees to seek and maintain certifications VESTRA has shown that it's committed to providing our customers with the best service and the highest standards."

Founded in 1988, VESTRA was one of the first firms in the United States dedicated to providing GIS solutions to respond to client's needs. The six founders had previously implemented one of the first GIS systems in the state for one of the largest timber management firms in Northern California. Due to the owners' reputation for excellence, customer service, and finding innovative technical solutions to problems, VESTRA grew rapidly, and became one of the first Esri authorized business partners in California.

Project Management Institute (PMI) is the world's leading not-for-profit professional membership association for the project, program and portfolio management profession. Founded in 1969, PMI delivers value for more than 2.9 million professionals working in nearly every country in the world through global advocacy, collaboration, education and research.

For more information about VESTRA Resources, Inc., please visit us online at http://www.vestra.com For more information about PMI, please visit them online at http://www.pmi.org.