
GeoSystems Monitor Enterprise
Be pro-active instead of reactive when an issue occurs.
The GeoSystems Monitor is a GIS application monitor, designed to give your GIS Administrator a better understanding of what is going on behind the scenes. By monitoring your GIS Platform and helping you diagnose and correct errors that affect your enterprise performance, the GeoSystems Monitor allows you to make more informed decisions and improve your systems’ performance, efficiency, and usability.
Some of the key functionalities of the GeoSystems Monitor are:
Real-Time Systems Monitoring
Instant Text / Email Alerts
Monitor ArcGIS for Server Services (Secure or Not), Web Maps, SDE Replication and more!
Track ArcGIS Server Usage and SDE Usage
License Manager Monitoring and Usage Reporting
Customized User Interface
Quick and Easy Installation
Rapidly Pinpoint Issues


GeoSystems Monitor Testimonials
GeoSystems Monitor allows me to better respond to issues in our system. Through its email and text message alerting capability, I know about critical system issues anywhere and at anytime. Maintaining the MD iMAP Enterprise GIS is one of our office's primary functions, and GeoSystems Monitor enables us to provide the level of service that our customers and agency leadership expect from an Enterprise GIS.

Prior to implementing GeoSystems Monitor there was no good accounting for multiple services and dependent systems in use, outages or performance of our platform. With GeoSystems Monitor, we now have increased awareness of issues at the moment they occur, which allows the team to be proactive in resolving problems before they negatively impact our customers. Prior to implementation, we would only become aware of problems after they had already negatively impacted a customer.

The fact that we knew of the outage and no one else did is exactly what attracted me to this package. We now have a tool that will help us be more proactive in our management.

We have been very happy with the performance of GeoSystems Monitor. It has allowed us to really get a good idea on what all of our services and data are being consumed and also being able to stay ahead of our users when something goes awry. The fact that we can track usage, as well as utilize the tool to keep track of when we have had issues has allowed us to provide metrics to our management on number of users vs. down time to show the value of how what we do on a daily basis keeps users running with very little issues.

This is the first time that I have purchased a software package directly as a result of a conference. I always go by all the vendors to see what innovations are out and to get new ideas. It is rare that the utility and cost of a package are such that I immediately pursue purchase. That is a credit to your product and helped make my attendance justified.


Dashboard Information
- The GeoSystems Monitor features a web-based user interface, which provides a centralized view of the servers and the monitoring “points” (the individual services, applications, etc. that are monitored within GeoSystems Monitor).
- This interface is configurable, and allows a GIS/IT professional to monitor all aspects of the Enterprise GIS architecture. The architecture of the GeoSystems Monitor has been specifically designed to make it easy to deploy and easy to customize.
- Charts and Reports that provide visual summary's of the monitoring information is collected and stored within the GeoSystems Monitor application.
- The Batch Editor is designed for modifying existing monitoring points and allows for batch editing.
- The License Manager is a module that can monitor and report on your FlexNet Publishing License Manager® (ex. esri, ACAD, FME or most any other application that utilizes the FlexNet Publishing License Manager [FlexLM®] license software).
CLICK TO ENLARGE THUMBNAIL


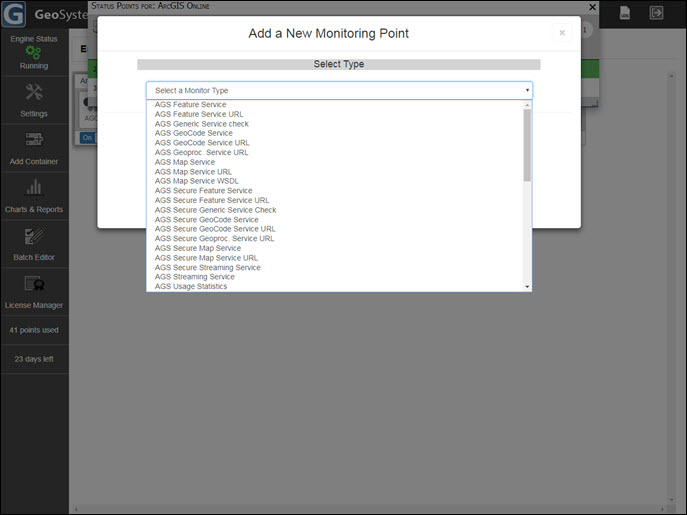
Monitoring Information
GeoSystems Monitor can monitor an ever-expanding list of GIS services and applications. Custom monitoring points can easily be created with python scripts, as well (for example: monitoring custom geoprocessing services, file transfer speeds, and more).
Sample list of monitoring points:
ArcGIS for Server Services
ArcGIS Online Services
ArcGIS Online Web Maps (includes organization content and external data sources)
ArcSDE Services
ArcSDE Layers
ArcIMS Services
ArcSDE Usage Monitoring and Usage Statistics Reporting
ArcGIS Server 10.1+ Usage Monitoring and Usage Statistics Reporting
Web Applications
WCS Services
WFS Services
WMS Services
Secure Services
Oracle Geodatabases
SQL Server Geodatabases
Postgres Geodatabases
Geodatabase Replication
Windows Services
Windows WMI Checks
Rest Services
RSS Feeds
License Manager Module (ex. Esri®, AutoCAD, FME or most any application that utilizes FlexLM® license Software
CLICK TO ENLARGE THUMBNAIL

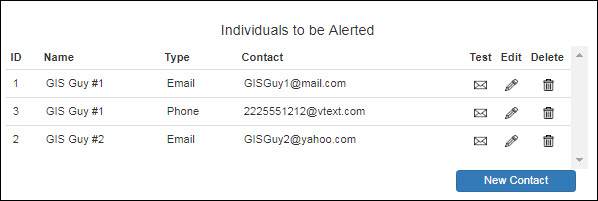
Alerts & Notifications
GeoSystems Monitor provides real-time information on the status of your Enterprise GIS.
The GeoSystems Monitor generates information by monitoring the applications (points) that reside on your servers and elsewhere. When the GeoSystems Monitor detects an issue, an immediate notification is sent to the designated professional via email or text, allowing them to troubleshoot and formulate a resolution. This allows for both increased productivity, improved system uptime and customer satisfaction.
CLICK TO ENLARGE THUMBNAIL

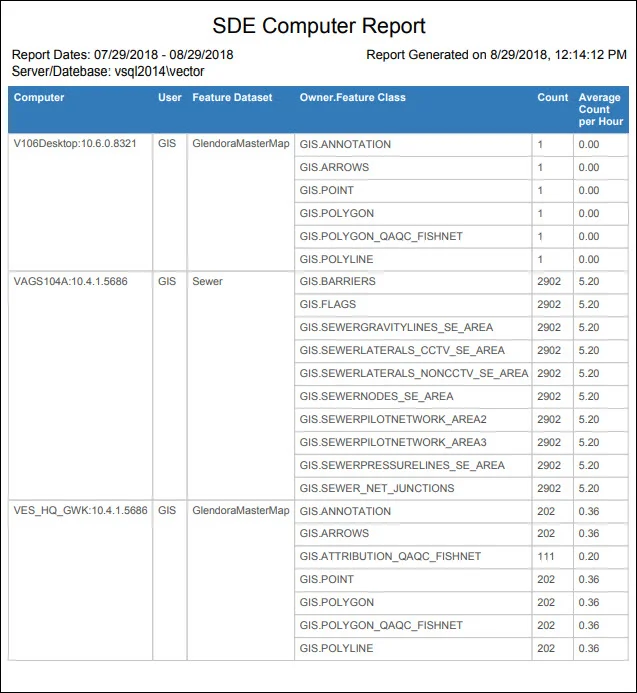
Usage Reporting
The GeoSystems Monitor provides ArcGIS for Server (AGS), SDE, and License Manager Usage Statistics. All of these performance metrics can be charted and reported using the GeoSystems Monitor Charts UI.
SDE Usage Reporting (generated from geodatabase feature datasets, feature classes and tables)
By user
By computer
Unused layer reporting
Summary Report
ArcGIS for Server (AGS) Usage Reporting and Performance Monitoring (generated by the GeoSystems Monitor reading the AGS site log for versions 10.1 and greater)
By user
Service response times
How often services are used
Summary Reprt
License Manager Monitoring and Usage Reporting
User Reports
Usage Reports
CLICK TO ENLARGE THUMBNAIL

Charting & Performance
The GeoSystems Monitor Charts and Reports Module provides visual and tabular summarizations of the monitoring information that is collected and stored within the GeoSystems Monitor application databases.
The charting tool is used to generate performance charts of response times, down counts, and slow counts for applications/services on an ArcGIS Server. Charts can also be generated to display usage information from the License Manager reports.
CLICK TO ENLARGE THUMBNAIL


Architecture
The GeoSystems Monitor architecture was specifically designed for ease of deployment and to allow customization to fit your unique monitoring needs. The core architecture elements include:
- Service architecture – GeoSystems Monitor provides real-time monitoring for the growing service-based architecture that is present in today’s GIS.
- Agentless – All monitoring occurs without requiring the installation of agents on monitored servers or services. This provides a monitoring solution that is easy to implement and manage over time.
- Customized monitoring – GeoSystems Monitor includes an extensive library of pre-configured monitoring end points. Custom monitoring scripts can be developed using Python® (the core programming language used in GeoSystems Monitor checks), in addition to other languages to fit unique monitoring needs.
- Flexible interface – GeoSystems Monitor’s dashboard interface is designed to allow user-defined organization with tabbed windows and “containers”, which are user-specified groups of monitoring end points.
CLICK TO ENLARGE THUMBNAIL
